Getting started with instrument data pipelines
This guide walks through a complete file-based instrument connection from initial setup to a reviewed run.
Before you begin
You need:
- organization administrator access in FlaskTrack;
- a computer that can remain online inside the laboratory network;
- access from that computer to the instrument output directory;
- the FlaskTrack Instrument Agent binary for that computer's operating system;
- an instrument export format supported by one of your FlaskTrack parser profiles.
The computer running the agent does not need to be the instrument workstation itself. It only needs access to the output folder or local vendor API that the connector will use.
1. Add the instrument
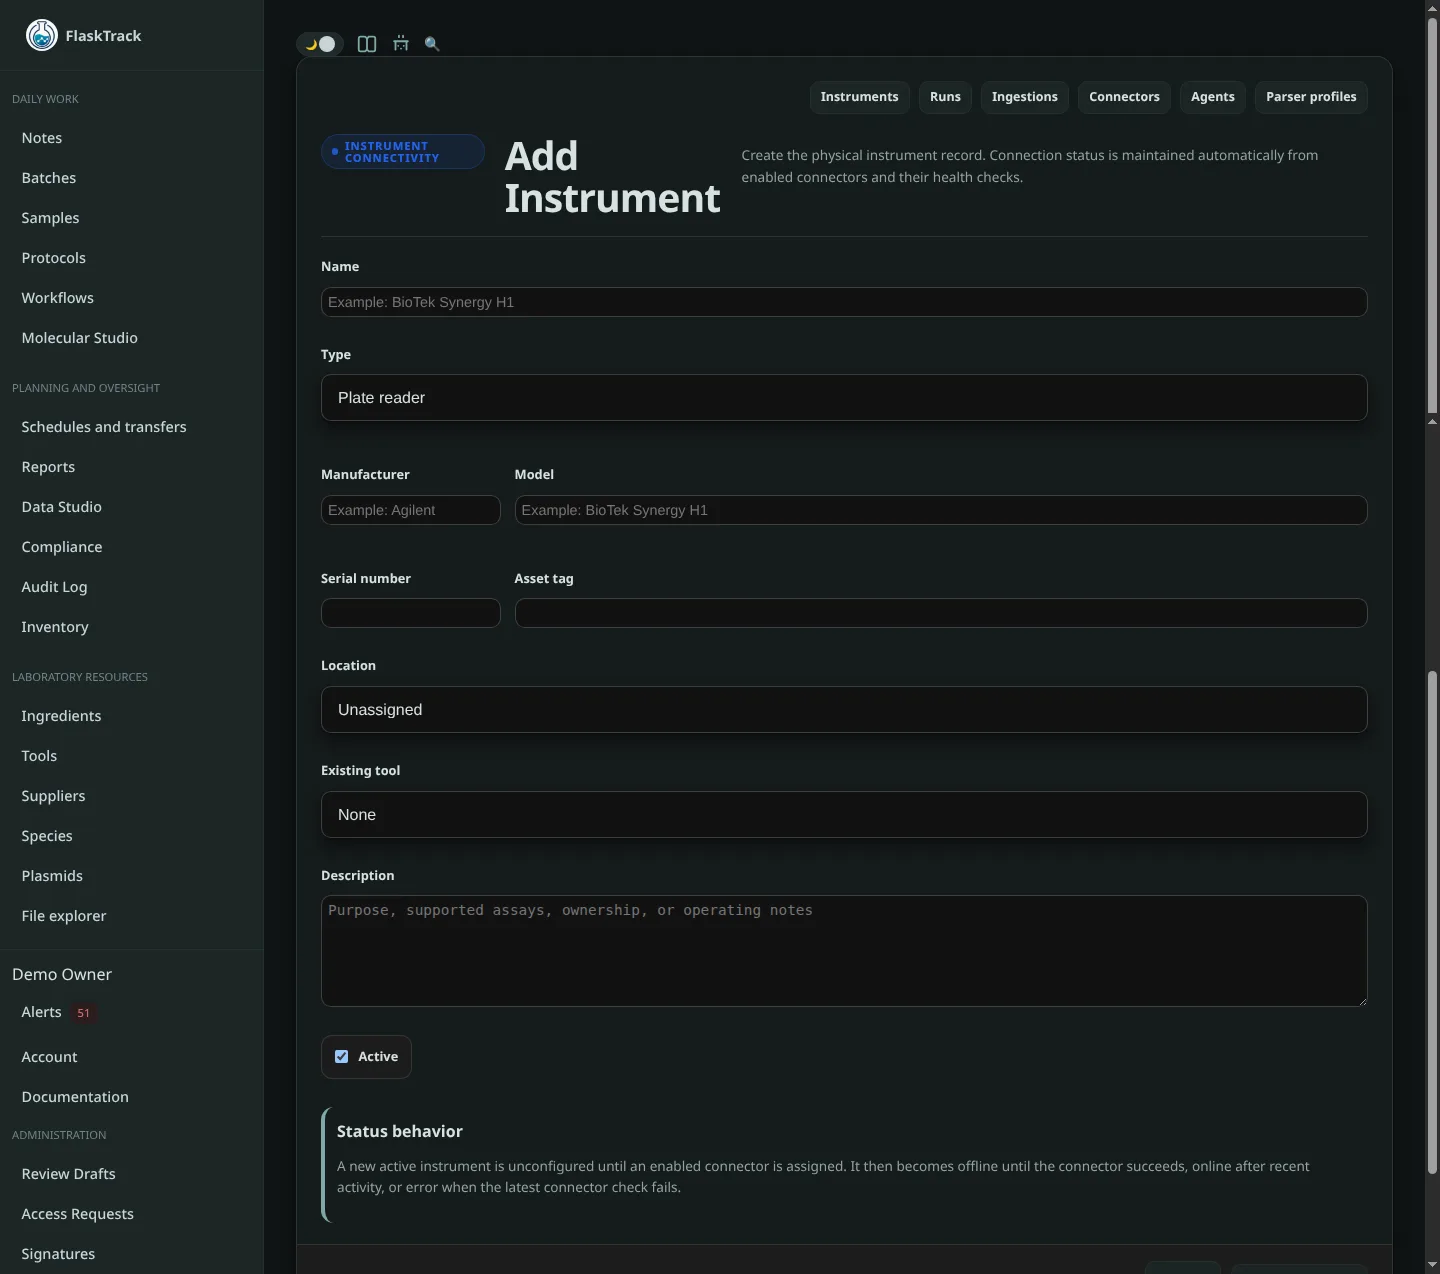
Open your organization's Instrument Connectivity area and add the physical instrument.
Enter information that helps operators identify the device later:
- instrument name;
- instrument type;
- manufacturer;
- model;
- serial number;
- asset tag, if used;
- laboratory or inventory location.
Example:
Name:          BioTek Synergy H1
Type:          Plate reader
Manufacturer:  Agilent BioTek
Model:         Synergy H1
Serial number: 1234567
Location:      Cell Culture Lab / Reader Bench
2. Create an Instrument Agent
Go to Instrument Agents and create a new agent for the computer that will run it.
Use a name that identifies the machine or its role, for example:
When the agent is created, FlaskTrack displays an agent key beginning with:
Copy the key when it is shown
Treat the agent key as a machine credential. Store it securely and do not include it in support screenshots, shell history, source control, or shared documentation.
If the key is lost, rotate the agent key in FlaskTrack and update the installed agent.
3. Install the agent
Follow Install and run the Instrument Agent for Linux, Windows, or macOS.
After initialization, run:
At this point it is normal for the agent to report zero assigned connectors if you have not created the connector yet.
4. Create a parser profile
If your organization already has a parser profile for the instrument format, you can reuse it.
Otherwise open Parser Profiles and create one using the parser key and parser version required for that file format.
For standardized long-form CSV exports, a deployment may use a generic CSV parser. The exact parser key available in your FlaskTrack environment determines which formats are accepted.
See Parser profiles.
5. Create the connector
Open Instrument Connectors and add a connector.
For a typical result folder:
Instrument:       BioTek Synergy H1
Instrument Agent: Main Lab Instrument Agent
Connector type:   File watcher
Direction:        Inbound
Watch path:       C:\BioTek\Exports
File pattern:     *.csv
Polling interval: 30
Parser key:       generic.csv.long.v1
Parser version:   1
Enabled:          Yes
The Watch path is evaluated on the Instrument Agent machine. It is not a path on the FlaskTrack cloud server.
Linux example:
Windows example:
Windows network share example:
Mounted Linux/macOS network share example:
6. Verify the configuration from the agent machine
After saving the connector, run:
A healthy file-watcher connector should report that the watch path is accessible.
If it does not, verify:
- the path exists on the agent machine;
- the account running the daemon can read the directory;
- network shares are mounted before the agent starts;
- the connector is assigned to the correct agent;
- the connector is enabled;
- the direction is Inbound or Bidirectional.
7. Test a single pass
Before enabling daemon mode, you can run one deterministic pass:
The agent will retrieve its current FlaskTrack configuration, scan assigned connectors, stage eligible files, upload pending artifacts, and send a heartbeat.
For file-based connectors, a source file must remain unchanged for the configured settle period before it is staged. This prevents the agent from reading a file while the instrument is still writing it.
8. Start daemon mode
Once the connection works, use the operating system service configuration described in Instrument Agents.
The daemon continually:
- retrieves updated connector configuration;
- checks assigned sources at their configured polling intervals;
- stages complete artifacts to the local spool;
- uploads pending artifacts;
- retries temporary failures;
- reports agent and connector health back to FlaskTrack.
9. Confirm the ingestion in FlaskTrack
Open Instrument Ingestions.
A new artifact normally moves through states such as:
If processing fails, the ingestion can appear as Failed or Quarantined and can be inspected by an administrator.
See Ingestions and processing.
10. Map the run
Open the resulting instrument run.
If FlaskTrack already has enough identity information, the run may be ready without manual mapping. Otherwise it appears as Mapping required.
For each position:
- choose the target type;
- search for the FlaskTrack record;
- select the correct result;
- save the mapping.
The source identifier supplied by the instrument may be used to prefill a Sample search, but the operator still selects the controlled FlaskTrack record.
See Runs, mapping, and review.
11. Submit for review
Once required mappings are complete, submit the run for review.
After review begins, mappings are locked. The run can then be accepted or rejected according to the configured electronic-signature workflow.